Dashboard Design Lab: Week 2 — Padding and Whitespace

Last week in our Dashboard Design Lab, we talked about the foundation of Designing to a Grid. This week, we’re diving into the next step: Padding and Whitespace. They might seem like minor details, but mastering them is the fastest way to make your data look less like a spreadsheet and more like a focused, professional insight tool.

Why Padding & Whitespace Matters in Tableau and Power BI
In design, whitespace isn’t just the color white, it’s the empty, un-occupied area around and between elements. It’s the visual separation that gives your content room to operate.
Reduces Visual Clutter: When everything is crammed together, the user’s eye doesn’t know where to land. Strategic spacing separates charts, KPIs, and titles, making the whole dashboard feel less overwhelming.
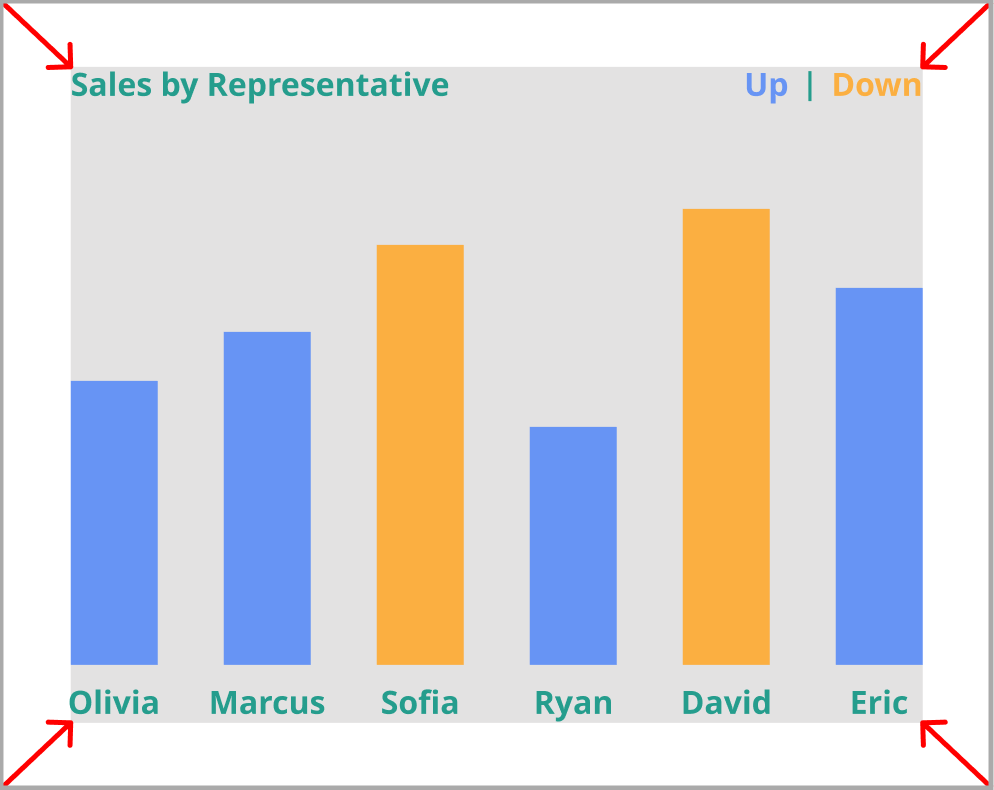
Improves Readability: Padding around the edges of a chart ensures the data points aren’t hugging the border. This slight buffer is critical for inner padding; it helps the user focus on the data itself instead of fighting the layout.
Establishes Hierarchy: More space around a key visual (like a main chart or primary KPI) draws the eye there first. You use spacing to guide the user’s journey through the data story.
Reinforces the Grid: Consistent gaps between your visual ‘cards’ using outer padding reinforces the alignment and balance we worked on last week, making your entire layout feel cohesive.
In both Tableau and Power BI, managing this ‘breathing room’ is key to polish. In Power BI, you’ll use the Format Visual settings to adjust the default 12px of padding and rely on alignment and grouping tools to maintain consistent gaps. In Tableau, you have the flexibility of adjusting both outer (space outside the chart) and inner (space inside the chart) padding, often best applied at the container level for consistent spacing across a section.
Key Concepts to Keep in Mind
The 10-20 Pixel Rule: As a starting point, aim for a minimum of 10 pixels of padding, with 12-30 pixels being the optimal range for a comfortable visual separation between elements.
Inner vs. Outer Padding: Pay close attention to both. Outer padding creates the space between charts/cards, and it should be consistent across your layout. Inner padding creates the necessary buffer inside your chart so that titles, axes, and data points aren’t right on the edge.
Container-Level Spacing: Whether using containers in Tableau or groups in Power BI, try to apply your consistent spacing at the highest level possible. This ensures that entire sections of your dashboard are visually separate from one another, making the overall view easier to digest.
Use Spacers Strategically: Especially in Power BI, it can sometimes be tough to nail a perfectly consistent gap. Don’t be afraid to use a temporary, small shape (like a 25x25 pixel square) as a visual guide or “spacer” between your cards to ensure those gaps are locked in.
Align and Group: Use the built-in alignment tools. Alignment combined with consistent padding is how you maintain visual rhythm and prevent charts from slowly drifting out of sync.
If you want a dashboard that not only works but looks polished and professional, you need to go beyond the data. Mastering the invisible power of padding and whitespace is the next step.
If you enjoyed this topic, make sure to share and subscribe for free to follow along with the Dashboard Design Lab series. Check back next week for Week 3.